Monday, May 28, 2018

Introduction to R and wide variety of things it can do

Definition: R is both a Programming Language and Software environment for Statistical analysis, graphics representation and and reporting.

It is an Open source and is freely available under GNU general public licence. It has all the capabilities of a intergated computer language like loops, branches and also has capabilities of Modular programming language and suppot functions.

Integration with other Platforms
R supports integration with procedures written other platforms including but not limited to(as it is growing everuday) C, C++, .Net, Python and Fortron.

Capabilities of R

R is big ecosystem now. The standard R distributed can do pretty much all you need in data manipulation, Reporting and analysis. Apart from there are thousands of packages on CRAN  and other open repositories.
So, it is not possible to list everything R can do. The features of R could further be divided as per the  different services lines. Below is list of some features which i could find:

General Programming

  • Object Oriented Programming
  • IO
  • Distributed Computing


Visualizations and Reporting

  • Static Visualization
  • Dynamic Visualization


Analytics

  • Statistics
  • Mathamatics
  • Probability
  • Machine Learning
  • Signal Processing
  • Simulation
  • Statistical Modeling and Test
  • and Big Data Analytics

I would try to post more details on the individual features in my future posts.
Wednesday, May 23, 2018

Power BI On-premises Report Server

We all know Microsoft launched Power BI in 2014 as a cloud based service only with per user licence. Since than Power BI has evolved a lot. Let it be Customer Visualisations, Power Bi Gateway or Power Bi embedded it is much better than before.
Today we are going to talk about Power Bi Report Server. It was a constant demand from microsoft to provide Power BI as an intranet tool, because not everyone is comfortable is pushing there data/reports on the cloud.

So, in last quarter of 2017 Microsoft launched an on-Premesis report server for power BI  called Power Bi Report Server. It has been developed on the existing SSRS server, so if you have used the SSRS server before you will find it pretty similar.
I am not going to go into installation steps because that's pretty neatly done here.
Follow the steps and you would be able to install and configure the server. If you still find any problems feel free to post in the comments below.

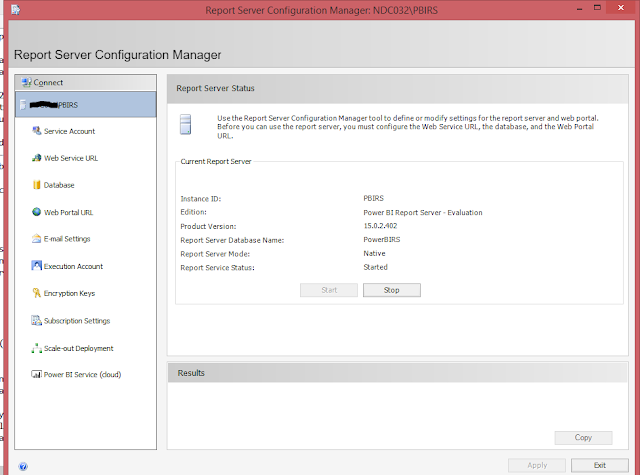
Once you have configured thePower BI server and database, it will look like this. I looks exactly the same as SSRS report server

Power Bi on premises report server


The new tab we noticed here(different from SSRS server) is the "Power Bi Service Cloud". If you have a power BI service account wth premium licence, you could take advantage if hybridoption. Microsoft has released this option to smooth transition of on-prem customers to cloud.
To create a new report you would need to download the Power Bi Desktop version for Report Server. Microsoft has released 2 separate versions of PBI desktop for Power BI Services and Power Bi On-Prem. Hopefully they will merge it later.

Tuesday, May 22, 2018

Business Analysis - The Big Picture

There is lots of buzz in the market about analytics and that's the reason there are brurred lines for new comers to understand the overall scenario.
Today i am trying to draw a picture to cover the complete picture of the complete analytics business and related technologies. But before we dig deeper, let us define what is data analytics.

Definition of Data Analytics
The purpose of data analytics is to study at the data and find out the patterns in data. This could be further drilled down to the size of data we are looking at and type of patterns we need a output.
Usually the output of Data Analytics is a reports, because that is what business people understand.

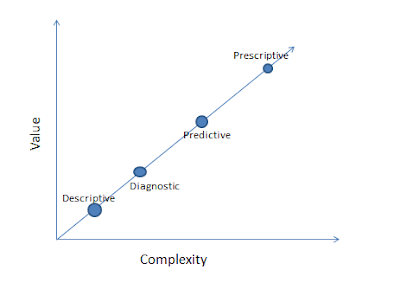
Based on the findings we need we could divide the analytics majorly in the 4 categories. Based on the requirement of the business we could fit the requirement in any of the 4 categories.
But it is important to understand that there are not clear boundaries. Below picture explains complexity of the types and the value it brings in.
Complexity vs value for data analytics


The first 2 type, Descriptive and Diagnostics are done after the event has happend. So we deal with the actual data of the business and tells the real picture. These 2 are mostly used together.

Descriptive analysis: What is happening
It is most common type of analytics and tell us what is happening. For e.g. it could tell us the monthly profit of the organisation for different demographic areas.
Effective visualizations are created to ensure right picture is visible to viewer.

Diagnostic Analysis: Why it is happening
After we know what is happening, it is important to understand the reasons. Use the diagnostic tools to drill down and isolate the root cause.

Comes next the more complex and valuable types of analytics Predictive and Prescriptive. This is forecasting of events based on the previous history and are mostly used together.
Predictive Analysis : What is likely to happen
Based of the previous data and predictive models, we forecast what is going to happen on a particular point of time. For eg. Every December the sales of retails companies increases.
As business world is full of uncertainties, it is always good to have certain information before hand. Which makes predictive analysis very powerful and valuable.

Prescriptive analysis : What to do 
This is most complex and valuable type of analysis. Here we tell the business that, based on th predictive analysis this is going to happen in this time frame and if we do this the opportunity could be maximized.
A day to day example would be Maps in our phone, which suggests us to take a different route when there is traffic on one route.

Will talk about different tools and models in a seperate post.

Monday, May 21, 2018

POWER BI and R

We are all aware of the revolutionary reporting tool of Microsoft Power BI. It has lots of inbuilt capabilities and could be further enhanced with the help of another powerful analytics language R

I tried to find out some information on this and some basic tutorials but no luck. Everything was very difficult to understand for people who are new to Power BI or R. So i thought of share my my understanding in a simplistic way. Below is how R could be used in Power BI.

Installation of R
Power Bi service know how to use R Powered visuals but when you create the Power Bi desktop requires a local R installation on your machine. R installation information is available on this URL
After installation, enable the R in the power BI desktop. the steps for the same are available to the URL mentioned above.

Using R in Power BI
R can be used in Power BI in 2 different ways.

  • Using R Script as a Data source: We could use R to load data into Power Bi like any other data source.
    To use R as data source, Click "Get Data" from menu and select R Script. It will open a dialog box where we could paste our R script. Paste your R script and click Load.
    If you are not familiar with R, you could use below sample data set. This just static  data set for learning purpose 
fruits <- data.frame(name = c("Apple", "Banana", "Grapes", "Grapes"), Id=c(1,2,3,4))
    fruit_sales <- data.frame(Id=c(1,2,3,4,3,2,1), qty= c(10,12,13,34,43,12,10))
    This code would create 2 data sets for Fruits and Fruit Sales. The power Bi is intelligent enough to create a relationship between the 2 data sets.
    • Using R Script to create a visualization
      To create a visualization using R, Select the R visual from the visualization pane. This will open an R script editor where we could add our code. Select the fields on which we need to visualize. I have selected Id and qty from the Toy_Sales.
      You would notice some comments(starting with #) in the editor which would suggest id and qty fields are loaded in the variable named dataset. Now we will use the plot function of R to plot a graph between ID and quantity sold. Write plot(dataset) in the editor.
      You would see a graph. This is just very basic and could be enhanced to any level as R has one of the most powerful visualizations.


    If you liked the post, please share it.
    Subscribe to your email and receive new articles on your email