The common operations on a cube are Slice, Dice, Drill-down, Roll-Up, pivot. These could be used individually or together to generate the desired picture of data.
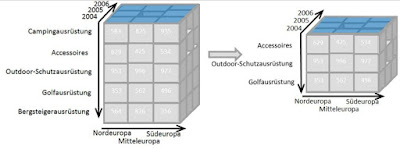
Slice is an act of picking a subset of the cube by choosing a single value for one of its dimensions. This create a new cube with fewer dimension.
The picture below shows a slicing operation: The sales figures of all categories and all regions is sliced for just year 2004.
Dicing allow the analysts to create and visualize a sub cube by selecting multiple values from multiple dimensions. The picture below shows dicing operation:
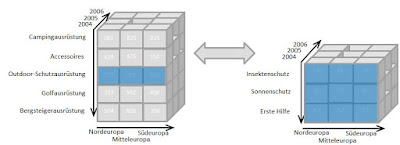
Drill down / up allows the analyst to navigate through the levels of data from most summarized to most detailed. The picture shows the drill down operation from summary category "Outdoor-Schutzausrüstung" to see the sales figures for the individual products.
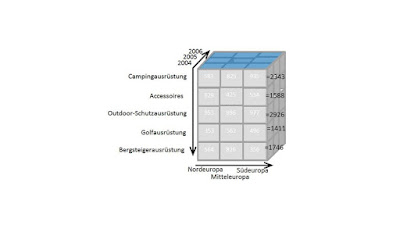
Roll Up means summarizing the data along a dimension. The summarization could be calculating, count, total across a dimension hierarchy or more complex formulas like profit from sales etc. The picture below shows the summation of sale for each categories.
Pivot allows the analysts to rotate the cube in space to the desired direction, which gives the data and visualizations a totally different perspective. The image below show that.


No comments:
Post a Comment