Showing posts with label BI. Show all posts

Saturday, September 8, 2018

Shrunken Dimension - Very useful for higher level summary

Shrunken Dimension is a very special type of dimension when there is a requirement of higher level of summary and lower grain data is already available in the warehouse.

Before we dive in if you do not understand what is the grain of the dimension, it is important to understand.

Month could be a shrunken dimension of date,  which could be connected to a fact which has grain of month like monthly sales. But this is a very classic example, let us deep dive a little with another example.
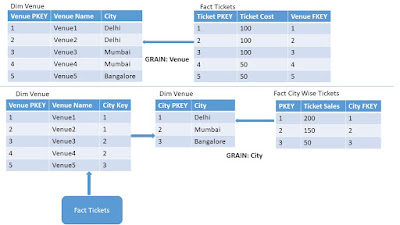
Considering the Online Movie Ticketing business scenario, we would have 2 tables, a fact for Ticket sales and a related dimension of the Venue for which sold the ticket. 
If customer need to view the total consolidated Sales at city level rather than Venue level, we could create a separate dimension for City and a separate fact table for Consolidated Sales. The image below demonstrates the same:
Shrunken Dimension Example

In the example above we have created a base dimension and Shrunken dimension separately. If needed we could also create the Shrunken dimension from the base dimension, once it is loaded. Again it totally depends on the business requirements and the type of source system you are dealing with.
Static Dimension in Datawarehouse

Static Dimension are not extracted from the data source, but created in warehouse itself in the context of warehouse. These are usually loaded just once, manually or by the help of a procedure. The data of this dimension does not change or changed very rarely.

A few common examples of the static dimensions would be "DIM_SOURCE_SYSTEMS", "DIM_STATUS_CODE" or date time as well.

Please do not confuse it with the SCD Type 0. In SCD type 0, we insert data regularly but never update it. Also, they are loaded with the data extracted from source.

Click here to read about the other dimensions in datawarehousing.

Sunday, August 12, 2018

OLTP vs OLAP explained

Both OLAP and OLTP are databases are designed for different purposes.

OLTP stands for Online Transaction Processing and is optimized for insert. update and delete operations. This is the reason these are used behind the application for regular business transactions.

OLAP stands for Online Analysis Processing and this databases are optimized for read operation and are widely used for analyzing, mining and reporting on large datasets.

It is important to note here that the database in which we store all the Facts and Dimensions is also OLTP. Post this we move the data to create a cube, which is stored in a OLAP database.

The image below explains the major differences of a OLTP and OLAP systems.
Now that we know the basic difference between OLTP and OLAP, lets now dig a little deeper.

  • The core of any OLAP system is a Cube, which is just a three-dimensional spreadsheet, where as in OLTP data is stored in 2D tables.
  • A cube consists of Numeric Facts called measures and are categorized by dimension data.
  • The metadata of any cube is star schema or Snowflake Schema or Fact Constellation in relational(OLTP) database. Measures are derived from the records in the fact table and dimensions are derived from dimension tables.
  •  While we can perform CRUD operation in OLTP, there are a few more operations which we could perform on a cube. These include Slicing, Dicing. Pivoting etc.

Different Operations on a OLAP cube in datawarehouse

The common operations on a cube are Slice, Dice, Drill-down, Roll-Up, pivot. These could be used individually or together to generate the desired picture of data.

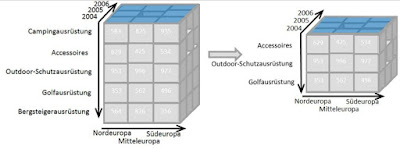
Slice is an act of picking a subset of the cube by choosing a single value for one of its dimensions. This create a new cube with fewer dimension.
The picture below shows a slicing operation:   The sales figures of all categories and all regions is sliced for just year 2004.
OLAP CUBE Slicing
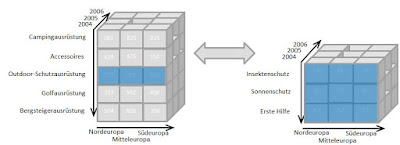
Dicing allow the analysts to create and visualize a sub cube by selecting multiple values from multiple dimensions. The picture below shows dicing operation:
OLAP CUBE Dicing
Drill down / up allows the analyst to navigate through the levels of data from most summarized to most detailed. The picture shows the drill down operation from summary category "Outdoor-Schutzausrüstung" to see the sales figures for the individual products.
OLAP CUBE Drill DOWN

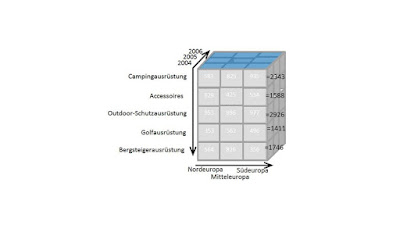
Roll Up means summarizing the data along a dimension. The summarization  could be calculating, count, total across a dimension hierarchy or more complex formulas like profit from sales etc. The picture below shows the summation of sale for each categories.
OLAP Cube Rollup

Pivot allows the analysts to rotate the cube in space to the desired direction, which gives the data and visualizations a totally different perspective. The image below show that.
OLAP Cube Pivoting


Wednesday, August 1, 2018

Snowflake schema

Snowflake Schema: When one fact is surrounded by a chain of more than one dimension, it is called snowflake. It is also called an extension of star schema by adding more dimensions.
In snowflake schema the table are normalized.

If you do not understand the basic concepts of data warehousing, please visit my previous article.

If we consider the data warehousing scenario detailed here, below is how a snowflake schema would look like.

Snowflake Schema
Click here to compare the same design with star schema.

Characteristics of Snowflake schema:

  • Less storage requirement because of normalized dimensions
  • Less time to load as compared to star schema.
  • Better slicing and dicing
  • Join complexity increase
  • Time to Query may increase a little depending on the scenario.
Click here to learn more about different types of schema.

Sunday, July 22, 2018

Bridge Tables in datawarehouse

As the name suggests, bridge table is used to link tables when direct linking does not make sense. Usually used in a little complecated senarios when we have many to many relations between 2 tables.
Example: Consider we have multiple customer linked to a single bank account balance. Putting multiple customer keys in that fact would create obvious problems in the fact table. 

Bridge table is also used sometimes to manage variable hierarchies. For e.g. to maintain one primary customer and one or more secondary customers.

Bridge table come to rescue in such situation, but just like outrigger dimension don't use it too much. Remember, every query has to pay toll to navigate the bridge.

Although, it is not a dimension but I personally call it Bridge dimension because it has many properties of a dimension.

Click here to read about the other dimensions in datawarehousing.

Tuesday, July 17, 2018

What is Outrigger Dimension and its purpose

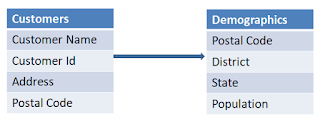
Definition:  As per Kimball, when in dimension in the DWH is linked with another dimension table, the secondary table is call outrigger dimension. For example a customer dimension referring to the Date dimension for the date of account creation.

Now, it might seem like snowflaked(not complete), but it is not. There are a few differences as detailed below:

  • Snowflake make the structure highly normalized where as outrigger makes it partially normalized.
  • Snowflake makes the ETL complicated and reduces the query performance.
While, Now outrigger dimensions are similar to snowflake but are vary limited in nature. They are just one or more levels removed fro the fact table. This is mostly used when there is a business requirement to slice and dice of the particular column. 

Consider the following criteria before creating an outrigger dimension:
  • User Analytics Needed: If the user wants to slice and dice on the column
  • Data Granularity vs Cardinality : A column with high low granularity and high cardinality is a candidate.
  • Update Frequency : If a column is updated very frequently, not more than once a month
  • It is divided in the source itself.
  • Customer and it location would be a good candidate for outrigger dimension
Outrigger Dimension

For list of dimensions in data-warehouse, click here

Thursday, June 28, 2018

ETL or ESB : What is better fit for your design

I have often seen people getting confused about, what would be a better fit for movement of data in their system. Their is a lot of content out their about these two technologies. Today i am trying to elaborate these in a very basic example.

Domino's(The pizza giant) logistics is a very good example to understand.
So how domino's works:
They prepare their dough, veggies, spices etc. in their factories than big giant trucks supply these materials to their outlets once or twice a day.

This is what ETL is. Scheduled movement of large quantity data from source to destination. Obviously in real scenario we do some data transformations in between.

The outlets usually have their delivery bikes to deliver the order in smaller chunks as they receive the order. This is ESB. Delivery of small chunks of data to the needy system in near real-time manner.

Would it make sense to use a large truck to deliver the pizzas only once or twice day or vice versa. This will not work at all. This is why it is important plugin in the right component in the system.

I hope i explained it well. Let me know if you have any questions?

Monday, June 18, 2018

Checksum - How to find incremental data when there are no dates column in the source, using Talend DI

I recently came across a situation where we needed to perform incremental on some data, but the problem we cam across is that there was no date column in the source feed which could help us find the incremental data.
When you have an insert date and update in the source you could simply filer the data of source using the date column. We could surely find out the the new inserts by comparing the business keys but to find out the updates one need to compare each column value. This would make the performance very bad if there many columns in the table.

Scenario:
Suppose we have an employee table in the both source and target table with some 20 columns. Now comparing each column of the table in both source and target db for each row could not be a solution. We decided to generate the checksum for each row in the data and compare the checksum values for each row.
What is Checksum: Checksum is an error detecting algorithm and it generates a unique number for a string provided. There are multiple algorithms to generate checksum and we used CRC32.

I am demonstrating this in Talend, but one could use almost any ETL tool to replicate the same.
For the purpose of demonstration , let us take 3 columns:

  • EmpId(PK)
  • Name(Changing Attr)
  • Salary(Changing Attr)


Table Employee source has these 3 columns. The table Employee Target would have same structure with one extra column name checksum. Consider the snapshot below to understand the data.


Below is how the talend job looks like.
Talend job for checksum

It reads the data from source employee table and the java code in the component "tJavaRow" adds another column named checksum to the flow. Below is how the java code looks like.
output_row.EmpID = input_row.EmpID;
output_row.Name = input_row.Name;
output_row.Salary = input_row.Salary;
String rowConcat= input_row.EmpID+input_row.Name+input_row.Salary;

CRC32 crc = new CRC32();
crc.update(rowConcat.getBytes());
output_row.Checksum=Long.toString(crc.getValue());

Here we have concatenated all the 3 columns and calculated the checksum on it. Please note that the sequence of column is important.

After that tMap is comparing the checksum value generated in the process and checksum value already available in the target table.

As seen in the out put below, one row went to the insert branch and 1 row went to the update branch.The log window below shows the checksum values generated.

Tuesday, May 22, 2018

Business Analysis - The Big Picture

There is lots of buzz in the market about analytics and that's the reason there are brurred lines for new comers to understand the overall scenario.
Today i am trying to draw a picture to cover the complete picture of the complete analytics business and related technologies. But before we dig deeper, let us define what is data analytics.

Definition of Data Analytics
The purpose of data analytics is to study at the data and find out the patterns in data. This could be further drilled down to the size of data we are looking at and type of patterns we need a output.
Usually the output of Data Analytics is a reports, because that is what business people understand.

Based on the findings we need we could divide the analytics majorly in the 4 categories. Based on the requirement of the business we could fit the requirement in any of the 4 categories.
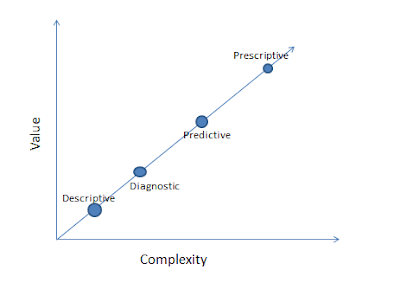
But it is important to understand that there are not clear boundaries. Below picture explains complexity of the types and the value it brings in.
Complexity vs value for data analytics


The first 2 type, Descriptive and Diagnostics are done after the event has happend. So we deal with the actual data of the business and tells the real picture. These 2 are mostly used together.

Descriptive analysis: What is happening
It is most common type of analytics and tell us what is happening. For e.g. it could tell us the monthly profit of the organisation for different demographic areas.
Effective visualizations are created to ensure right picture is visible to viewer.

Diagnostic Analysis: Why it is happening
After we know what is happening, it is important to understand the reasons. Use the diagnostic tools to drill down and isolate the root cause.

Comes next the more complex and valuable types of analytics Predictive and Prescriptive. This is forecasting of events based on the previous history and are mostly used together.
Predictive Analysis : What is likely to happen
Based of the previous data and predictive models, we forecast what is going to happen on a particular point of time. For eg. Every December the sales of retails companies increases.
As business world is full of uncertainties, it is always good to have certain information before hand. Which makes predictive analysis very powerful and valuable.

Prescriptive analysis : What to do 
This is most complex and valuable type of analysis. Here we tell the business that, based on th predictive analysis this is going to happen in this time frame and if we do this the opportunity could be maximized.
A day to day example would be Maps in our phone, which suggests us to take a different route when there is traffic on one route.

Will talk about different tools and models in a seperate post.
If you liked the post, please share it.
Subscribe to your email and receive new articles on your email