Showing posts with label Design. Show all posts

Saturday, September 8, 2018

Shrunken Dimension - Very useful for higher level summary

Shrunken Dimension is a very special type of dimension when there is a requirement of higher level of summary and lower grain data is already available in the warehouse.

Before we dive in if you do not understand what is the grain of the dimension, it is important to understand.

Month could be a shrunken dimension of date,  which could be connected to a fact which has grain of month like monthly sales. But this is a very classic example, let us deep dive a little with another example.
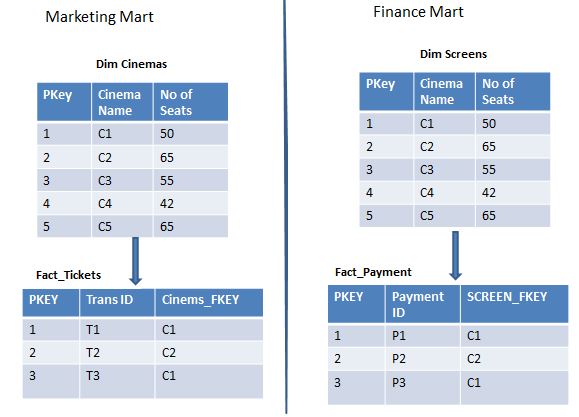
Considering the Online Movie Ticketing business scenario, we would have 2 tables, a fact for Ticket sales and a related dimension of the Venue for which sold the ticket. 
If customer need to view the total consolidated Sales at city level rather than Venue level, we could create a separate dimension for City and a separate fact table for Consolidated Sales. The image below demonstrates the same:
Shrunken Dimension Example

In the example above we have created a base dimension and Shrunken dimension separately. If needed we could also create the Shrunken dimension from the base dimension, once it is loaded. Again it totally depends on the business requirements and the type of source system you are dealing with.

Static Dimension in Datawarehouse

Static Dimension are not extracted from the data source, but created in warehouse itself in the context of warehouse. These are usually loaded just once, manually or by the help of a procedure. The data of this dimension does not change or changed very rarely.

A few common examples of the static dimensions would be "DIM_SOURCE_SYSTEMS", "DIM_STATUS_CODE" or date time as well.

Please do not confuse it with the SCD Type 0. In SCD type 0, we insert data regularly but never update it. Also, they are loaded with the data extracted from source.

Click here to read about the other dimensions in datawarehousing.

Sunday, August 12, 2018

Different Operations on a OLAP cube in datawarehouse

The common operations on a cube are Slice, Dice, Drill-down, Roll-Up, pivot. These could be used individually or together to generate the desired picture of data.

Slice is an act of picking a subset of the cube by choosing a single value for one of its dimensions. This create a new cube with fewer dimension.
The picture below shows a slicing operation:   The sales figures of all categories and all regions is sliced for just year 2004.
OLAP CUBE Slicing
Dicing allow the analysts to create and visualize a sub cube by selecting multiple values from multiple dimensions. The picture below shows dicing operation:
OLAP CUBE Dicing
Drill down / up allows the analyst to navigate through the levels of data from most summarized to most detailed. The picture shows the drill down operation from summary category "Outdoor-Schutzausrüstung" to see the sales figures for the individual products.
OLAP CUBE Drill DOWN

Roll Up means summarizing the data along a dimension. The summarization  could be calculating, count, total across a dimension hierarchy or more complex formulas like profit from sales etc. The picture below shows the summation of sale for each categories.
OLAP Cube Rollup

Pivot allows the analysts to rotate the cube in space to the desired direction, which gives the data and visualizations a totally different perspective. The image below show that.
OLAP Cube Pivoting


Sunday, August 5, 2018

Fact Constellation schema in Data warehousing

Fact Constellation: Fact Constellation allows you to connect multiple facts to dimensions. It is combination of multiple stars connected with each other using dimension, hence called Galaxy or Fact Constellation schema.

As compared to Star and snowflake it is used for more sophisticated application. The dimension tables could be normalized or not as per the requirement.

If you do not understand the basic concepts of data warehousing, please visit my previous article.

If we consider the data warehousing scenario detailed here, below is how is galaxy or fact constellation schema would look like.


Fact Constellation or Galaxy Schema

Characteristics of Fact Constellation schema:

  • Complex design
  • Different variants of aggregations
  •  Suitable for more sophisticate application 

Wednesday, August 1, 2018

Snowflake schema

Snowflake Schema: When one fact is surrounded by a chain of more than one dimension, it is called snowflake. It is also called an extension of star schema by adding more dimensions.
In snowflake schema the table are normalized.

If you do not understand the basic concepts of data warehousing, please visit my previous article.

If we consider the data warehousing scenario detailed here, below is how a snowflake schema would look like.

Snowflake Schema
Click here to compare the same design with star schema.

Characteristics of Snowflake schema:

  • Less storage requirement because of normalized dimensions
  • Less time to load as compared to star schema.
  • Better slicing and dicing
  • Join complexity increase
  • Time to Query may increase a little depending on the scenario.
Click here to learn more about different types of schema.

Star Schema - The simplest of all

Star Schema : It is simplest data warehouse schema. It is called star because it resembles the star with points radiating out of the center. Fact tables is the center of the star and dimensions sit at the points.
Usually the fact table in the star schema is in 3rd normal form and dimensions are usually de-normalized. It is most simplest and most commonly used schema.

If you do not understand the basic concepts of data warehousing, please visit my previous article.

If we consider the data warehousing scenario detailed here, below is how a star schema would look like.
Star Schema

Although, star schema require just one fact table at the center, but you could surely have multiple stars in your design.

Characteristics of  star schema

  • Simplest design
  • Better query performance.
  • A little extra time to load the data into dimension because of de-normalization.
  • More space because of redundancy in dimensions.
Click here to learn more about different types of schema.

Tuesday, July 17, 2018

What is Outrigger Dimension and its purpose

Definition:  As per Kimball, when in dimension in the DWH is linked with another dimension table, the secondary table is call outrigger dimension. For example a customer dimension referring to the Date dimension for the date of account creation.

Now, it might seem like snowflaked(not complete), but it is not. There are a few differences as detailed below:

  • Snowflake make the structure highly normalized where as outrigger makes it partially normalized.
  • Snowflake makes the ETL complicated and reduces the query performance.
While, Now outrigger dimensions are similar to snowflake but are vary limited in nature. They are just one or more levels removed fro the fact table. This is mostly used when there is a business requirement to slice and dice of the particular column. 

Consider the following criteria before creating an outrigger dimension:
  • User Analytics Needed: If the user wants to slice and dice on the column
  • Data Granularity vs Cardinality : A column with high low granularity and high cardinality is a candidate.
  • Update Frequency : If a column is updated very frequently, not more than once a month
  • It is divided in the source itself.
  • Customer and it location would be a good candidate for outrigger dimension
Outrigger Dimension

For list of dimensions in data-warehouse, click here

Wednesday, July 11, 2018

What is grain of a table in data warehousing

In simple terms grain is the lowest level till which you could identify the data in a table.
For example: If you have table which holds the stock inventory and table holds:

  1. One record for each day of the stock : Than the grain would be one day
  2. One record for each hour : than the grain of the table would be hour
  3. One record for each week : than the grain of the week would be week.


How does grain impacts the data warehouse:
It is important that while designeing the databse we design till the lowest grain for which we business needs to analyse or report.
With example above, If your Stock inventory table has grain of day you can easily calculate weekly stock but viceversa is not true.

Similarly, grain of related tables(Facts and Dims) should complement each other. For eg if Fact_Stock_Inventory holds data for each hour and Dim_DateTime has a grain of a day, it will generate distorted results.

Tuesday, July 10, 2018

What is Conformed Dimension and its advantages

People usually finds it difficult to understand the Conformed dimension, I am trying to explain it with an example. To start with, please do not confuse it confirmed / static dimension, because of the name.

Definition: A conformed is defined as a dimension, which has the same meaning to all the facts in a data warehouse, even if the facts belong to different data-marts.
It could one single table or multiple copies of same table across different marts. There is no hard rule  of the copies having the same table name. One copy could even be a sub set of another copy.

Let us now try to understand it with a example. Consider online movie tickets data warehouse scenario.
Lets assume we have divided our EDW into 2 data marts

  • Marketing : Marketing team is more concerned about the no of tickets sold.
  • Finance : Finance team is more concerned about the profit.


Both teams would require to know the stats for each cinema. Now, both teams might also have different terminologies. Marketing team might call it Cinems whereas finance team might call it Screen.
So in this scenario we could create 2 copies of same table with different names as shown below.
Confirmed dimension explained


But why should we use it. Why don't we create 2 separate tables if we need. Below are a few disadvantages of not creating Conformed dimensions:

  • There will more ETL work to generate the logic of different tables.
  • More ETL will surely mean some extra maintenance effort.
  • and possible difficulties in joining multiple data marts. 

Visit my post on Types of Dimensions to understand more about different types of dimensions.

Monday, July 9, 2018

List of dimensions in a Data Warehouse

Below is the list of dimensions types we should consider while designing any data warehouse. Click on the link below for a detailed definition and example.


This list will keep on improving with time, so you can bookmark this page and  feel free to subscribe to the blog by entering your email

Friday, July 6, 2018

What is Junk Dimension and its purpose

Definition: By definition, it is a collections of random transnational code flags. It is usually created by joining multiple low cardinality dimensions into one.
As we merge different dimensions in to one, it will reduce the number of foreign keys in the fact table.

If we consider the Data warehouse scenario of Online Ticket Booking, The design should have following 3 tables, with fact having 2 foreign keys one for each dim.

  • Fact_Tickets
  • Dim Transaction Type
  • Dim Cert Type

Both Dims are of very low cardinality(i.e. no of records in each dim would be very low)
Transaction Type : The values could be Net-banking, Card, Wallet. The chances of increasing this count is very low
Movie Certificate : The values could be U, A, U/A. Again the chances of increasing/Changing these is very rare.

The picture below describes the 2 possible designs of it, if  we keep these parameters in dimension table.
Junk dimension


So with the help of junk dimension, we converted 2 forein keys in to one.
No of Records: Notice that, the no of records in the junk transaction is the multiplication of no of records in each dimension. In the example above there are 3 records for both Transaction and Certificate, so the total count in junk dimension is 9.
If we are merging 3 tables with 3 records each, the no of records in the junk dimension would be 27(3*3*3)

Ensure the dimensions we junk together should be of very low cardinality. I would suggest the no of records in the junk transaction should be less than thousand.

Please feel free to post your queries in the comments section and follow this blog.

Thursday, June 28, 2018

ETL or ESB : What is better fit for your design

I have often seen people getting confused about, what would be a better fit for movement of data in their system. Their is a lot of content out their about these two technologies. Today i am trying to elaborate these in a very basic example.

Domino's(The pizza giant) logistics is a very good example to understand.
So how domino's works:
They prepare their dough, veggies, spices etc. in their factories than big giant trucks supply these materials to their outlets once or twice a day.

This is what ETL is. Scheduled movement of large quantity data from source to destination. Obviously in real scenario we do some data transformations in between.

The outlets usually have their delivery bikes to deliver the order in smaller chunks as they receive the order. This is ESB. Delivery of small chunks of data to the needy system in near real-time manner.

Would it make sense to use a large truck to deliver the pizzas only once or twice day or vice versa. This will not work at all. This is why it is important plugin in the right component in the system.

I hope i explained it well. Let me know if you have any questions?
If you liked the post, please share it.
Subscribe to your email and receive new articles on your email